Greenhouse Gas Visualization & Prediction
Canopy
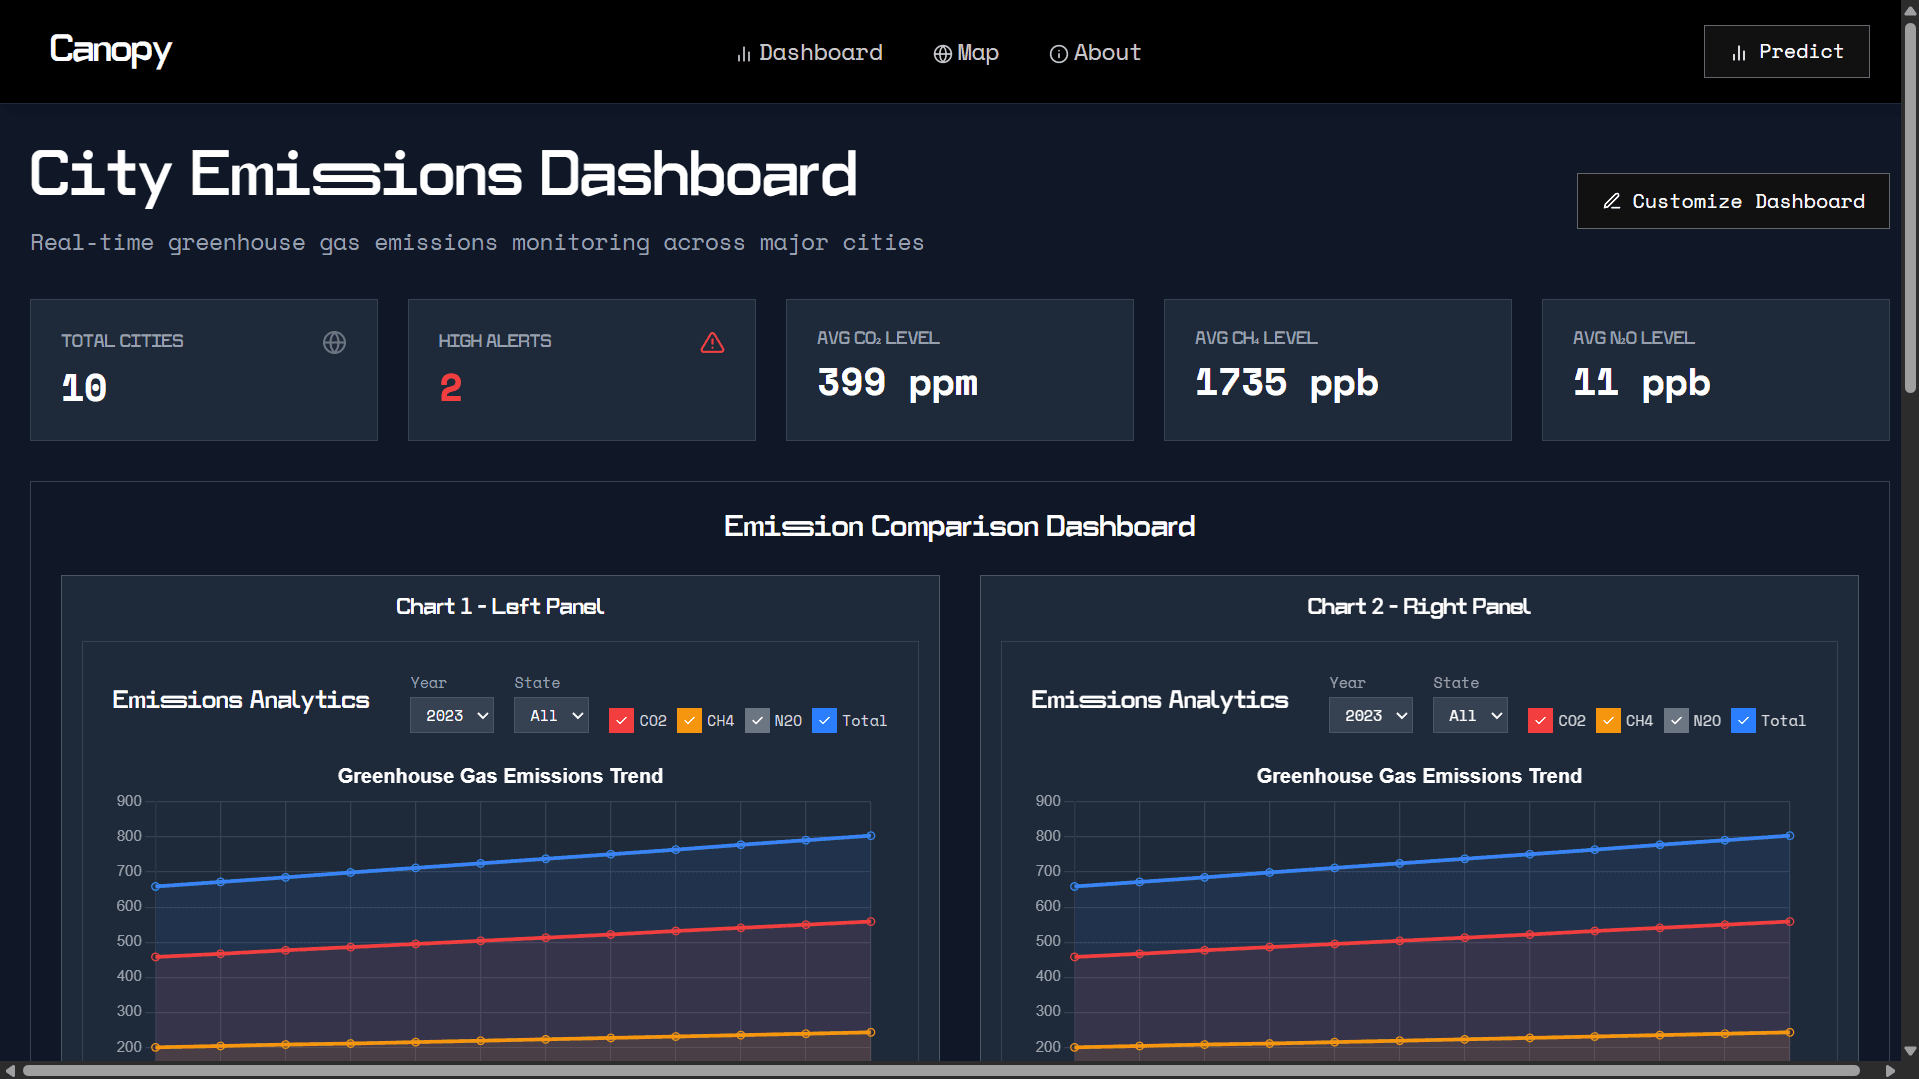
A climate analytics and emission forecasting dashboard built with FastAPI and TensorFlow during a 24-hour NASA Space Apps hackathon.
Problem
Needed to process large satellite datasets into an accessible, high-performance web dashboard with ML-based emission forecasting, all within a 24-hour hackathon.
Solution
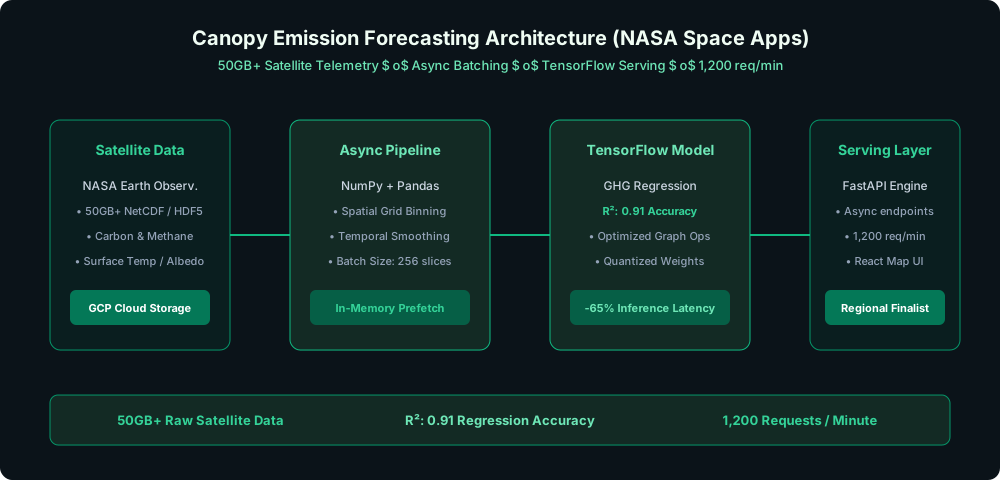
Deployed a FastAPI backend with async processing and batch operations. Built a TensorFlow regression model (R²: 0.91) with an optimized serving architecture. Paired with a responsive React frontend.
System Architecture & Data Pipeline
Data & ML Pipeline: 50GB+ NASA satellite telemetry processed through an asynchronous batch engine with in-memory prefetching, driving a TensorFlow regression model (R²: 0.91) served via FastAPI at 1,200 req/min.
Highlights
- Earned Regional Finalist recognition at NASA Space Apps Hackathon 2024.
- Built a TensorFlow regression model achieving R²: 0.91 accuracy for greenhouse gas emission prediction.
- Reduced model prediction latency by 65% through an optimized FastAPI serving architecture with async processing.
Impact
Delivered a working emission forecasting MVP within 24 hours at NASA Space Apps 2024, earning Regional Finalist recognition. Built a TensorFlow regression model achieving R²: 0.91. Reduced model prediction latency by 65% through optimized serving architecture.